%20rotate(-45)'/%3e%3cpath%20id='Rectangle_4'%20data-name='Rectangle%204'%20class='cls-2'%20d='M77.46,23.45l14.57-14.57c11.84-11.84,31.03-11.84,42.87,0l43.94,43.94c11.84,11.84,11.84,31.03,0,42.87l-14.57,14.57h0L77.46,23.45h0Z'/%3e%3cg%3e%3cpath%20class='cls-1'%20d='M283.26,141.98h-5.3l-12.5-36.8v47.6h-8.8v-70h9l14.9,43.5,15.1-43.5h9.3v70h-9.1v-47.6l-12.6,36.8Z'/%3e%3cpath%20class='cls-1'%20d='M316.15,152.78v-70h29.5v8.3h-20.1v22h17v8.4h-17v23h20.4v8.3h-29.8Z'/%3e%3cpath%20class='cls-1'%20d='M384.55,91.08h-12.2v61.7h-9.4v-61.7h-12.2v-8.3h33.8v8.3Z'/%3e%3cpath%20class='cls-1'%20d='M391.45,152.78v-70h29.5v8.3h-20.1v22h17v8.4h-17v23h20.4v8.3h-29.8Z'/%3e%3cpath%20class='cls-1'%20d='M457.65,152.78l-9.7-28.7h-8.2v28.7h-9.4v-70h17.5c10.6,0,17,4.5,17,14.8v11.7c0,7-3,11.3-8.2,13.4l10.6,30.1h-9.6ZM439.75,115.88h7.7c5.2,0,8-2.1,8-8.3v-8.2c0-6.2-2.8-8.3-8-8.3h-7.7v24.8Z'/%3e%3cpath%20class='cls-1'%20d='M509.95,97.58v12.5c0,10.3-6.4,14.8-17,14.8h-8.1v27.9h-9.4v-70h17.5c10.6,0,17,4.5,17,14.8ZM500.55,99.38c0-6.2-2.8-8.3-8-8.3h-7.7v25.4h7.7c5.2,0,8-2.1,8-8.2v-8.9Z'/%3e%3cpath%20class='cls-1'%20d='M535.15,81.98h.8c10.6,0,17,4.5,17,14.8v42c0,10.3-6.4,14.8-17,14.8h-.8c-10.6,0-17-4.5-17-14.8v-42c0-10.4,6.4-14.8,17-14.8ZM535.55,145.28c5.2,0,8-2.1,8-8.3v-38.4c0-6.2-2.8-8.3-8-8.3s-8,2.1-8,8.3v38.4c0,6.2,2.8,8.3,8,8.3Z'/%3e%3cpath%20class='cls-1'%20d='M591.05,152.78l-9.7-28.7h-8.2v28.7h-9.4v-70h17.5c10.6,0,17,4.5,17,14.8v11.7c0,7-3,11.3-8.2,13.4l10.6,30.1h-9.6ZM573.15,115.88h7.7c5.2,0,8-2.1,8-8.3v-8.2c0-6.2-2.8-8.3-8-8.3h-7.7v24.8Z'/%3e%3cpath%20class='cls-1'%20d='M637.75,91.08h-12.2v61.7h-9.4v-61.7h-12.2v-8.3h33.8v8.3Z'/%3e%3cpath%20class='cls-1'%20d='M663.05,136.28h-15l-3,16.5h-9.1l13.9-70h11.6l14.1,70h-9.6l-2.9-16.5ZM661.55,128.38l-6-33.8-6.1,33.8h12.1Z'/%3e%3cpath%20class='cls-1'%20d='M710.85,152.78h-28.3v-70h9.4v61.5h18.9v8.5Z'/%3e%3c/g%3e%3c/g%3e%3c/g%3e%3c/svg%3e)
What you see in your app
When you open the Meterportal app, you quickly get an overview of your water consumption – both in total and in detail.
Back to guides
When you open the Meterportal app, you quickly get an overview of your water consumption – both in total and in detail.
📊 Overview page
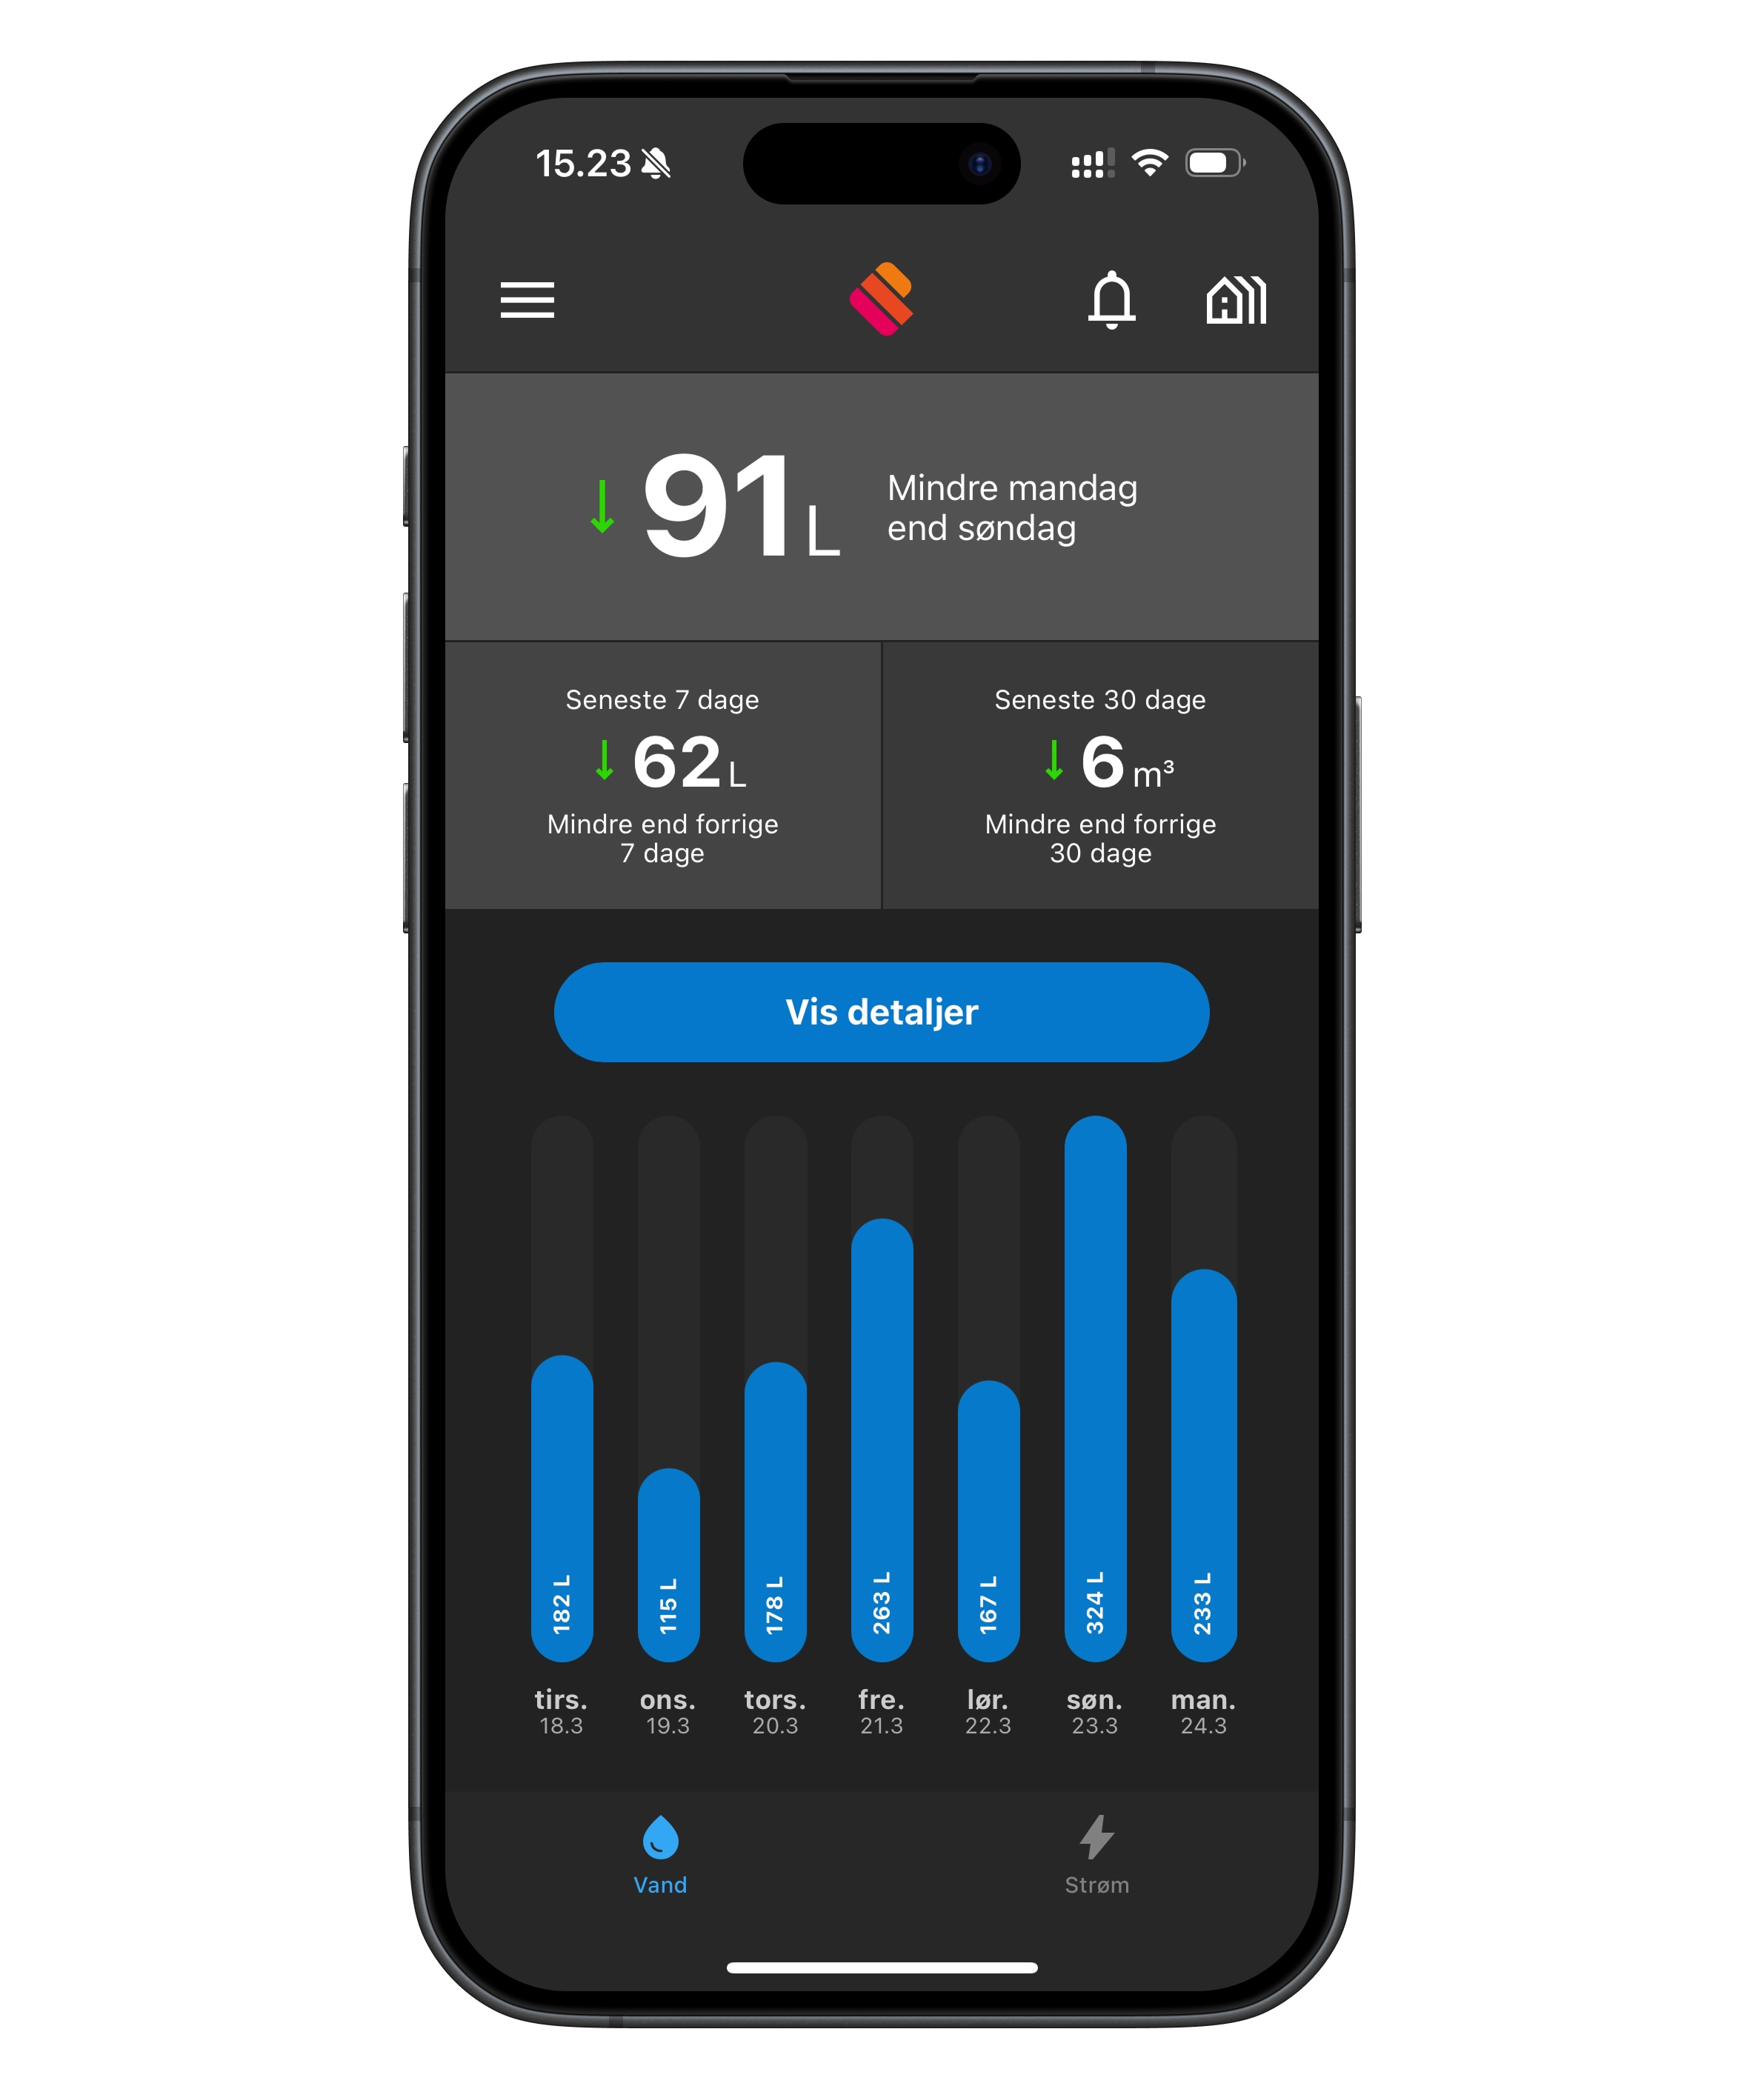
On the front page you get a visual summary of your consumption:
- How much you have used today compared to yesterday.
- Average consumption over the past 7 and 30 days.
- A bar chart showing your daily consumption – so you can easily see which days use the most water.
Tap "Show details" for even more insight.
⏱️ Detailed consumption (hours, days, months, years)
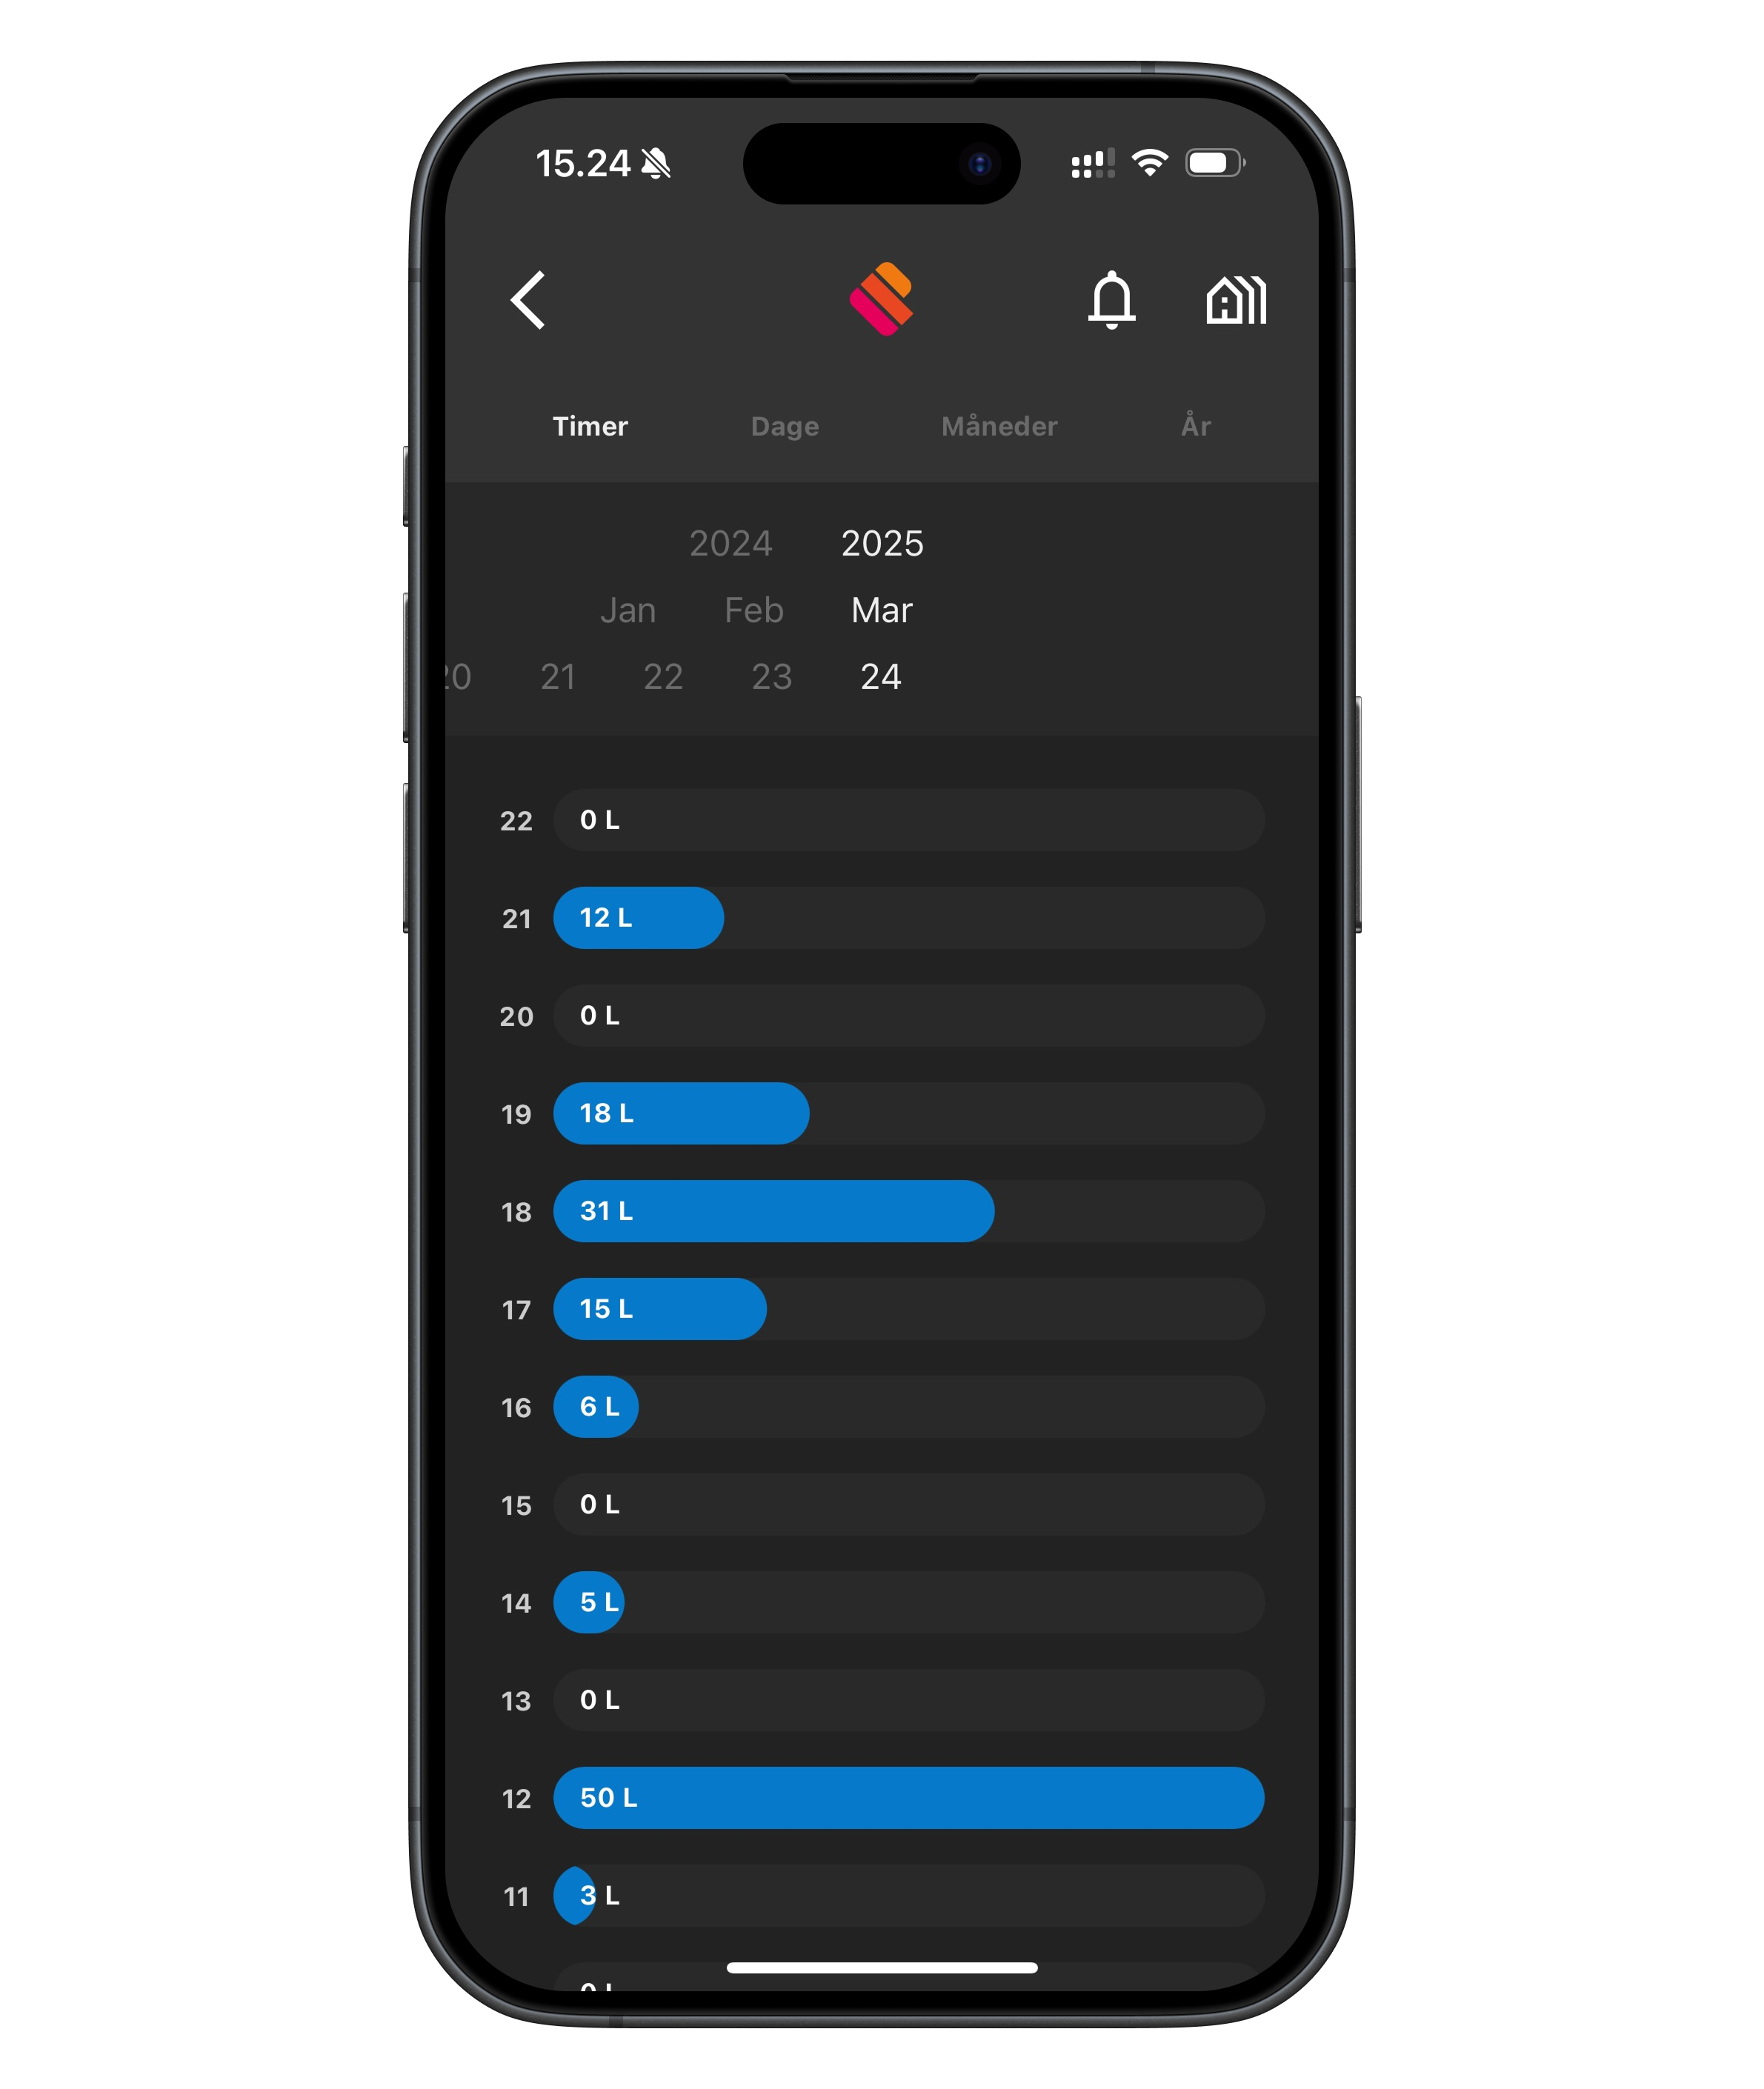
When you go into the details, you can see:
- Consumption hour by hour – perfect for spotting leaks or unusual consumption.
- The option to switch the view between hours, days, months and years at the top.
- Data presented in clear charts with amounts in litres or cubic metres.
💡 Use this feature to follow your consumption over time and keep track of changes in your everyday life.
Do you have questions about how to read the numbers? Then please write to us at info@meterportal.eu – we are happy to help!